Rounding Error and Total Error
Reducing the step size decreases the truncation error, but there is a lower limit. When becomes very small, a different source of error dominates: rounding error (also known as loss of significance). Understanding how both errors combine reveals why there is an optimal step size that minimises the total error.
Why Small Amplifies Rounding Error
When is very small, the values and become nearly identical. For example, if :
Subtracting two numbers that are almost equal causes catastrophic cancellation: the significant digits cancel out, leaving only the rounding noise in the least significant bits. This noise is then divided by the tiny value , which amplifies the error severely.
The Floating-Point Error Model
Based on the floating-point representation (where is the relative rounding error), evaluating the function at the shifted points introduces small multiplicative errors:
where and is the machine epsilon: the upper bound on the relative rounding error for the floating-point system in use.
Total Error Formula
The total error in the central difference approximation is the sum of the truncation error and the rounding error:
| Component | Scales with | Behaviour as |
|---|---|---|
| Truncation error | proportional to | Decreases toward zero |
| Rounding error | proportional to | Increases without bound |
The Optimal Step Size
Because the two error components move in opposite directions as changes, the total error graph forms a distinct V-shaped (or U-shaped) curve when plotted on a logarithmic scale.
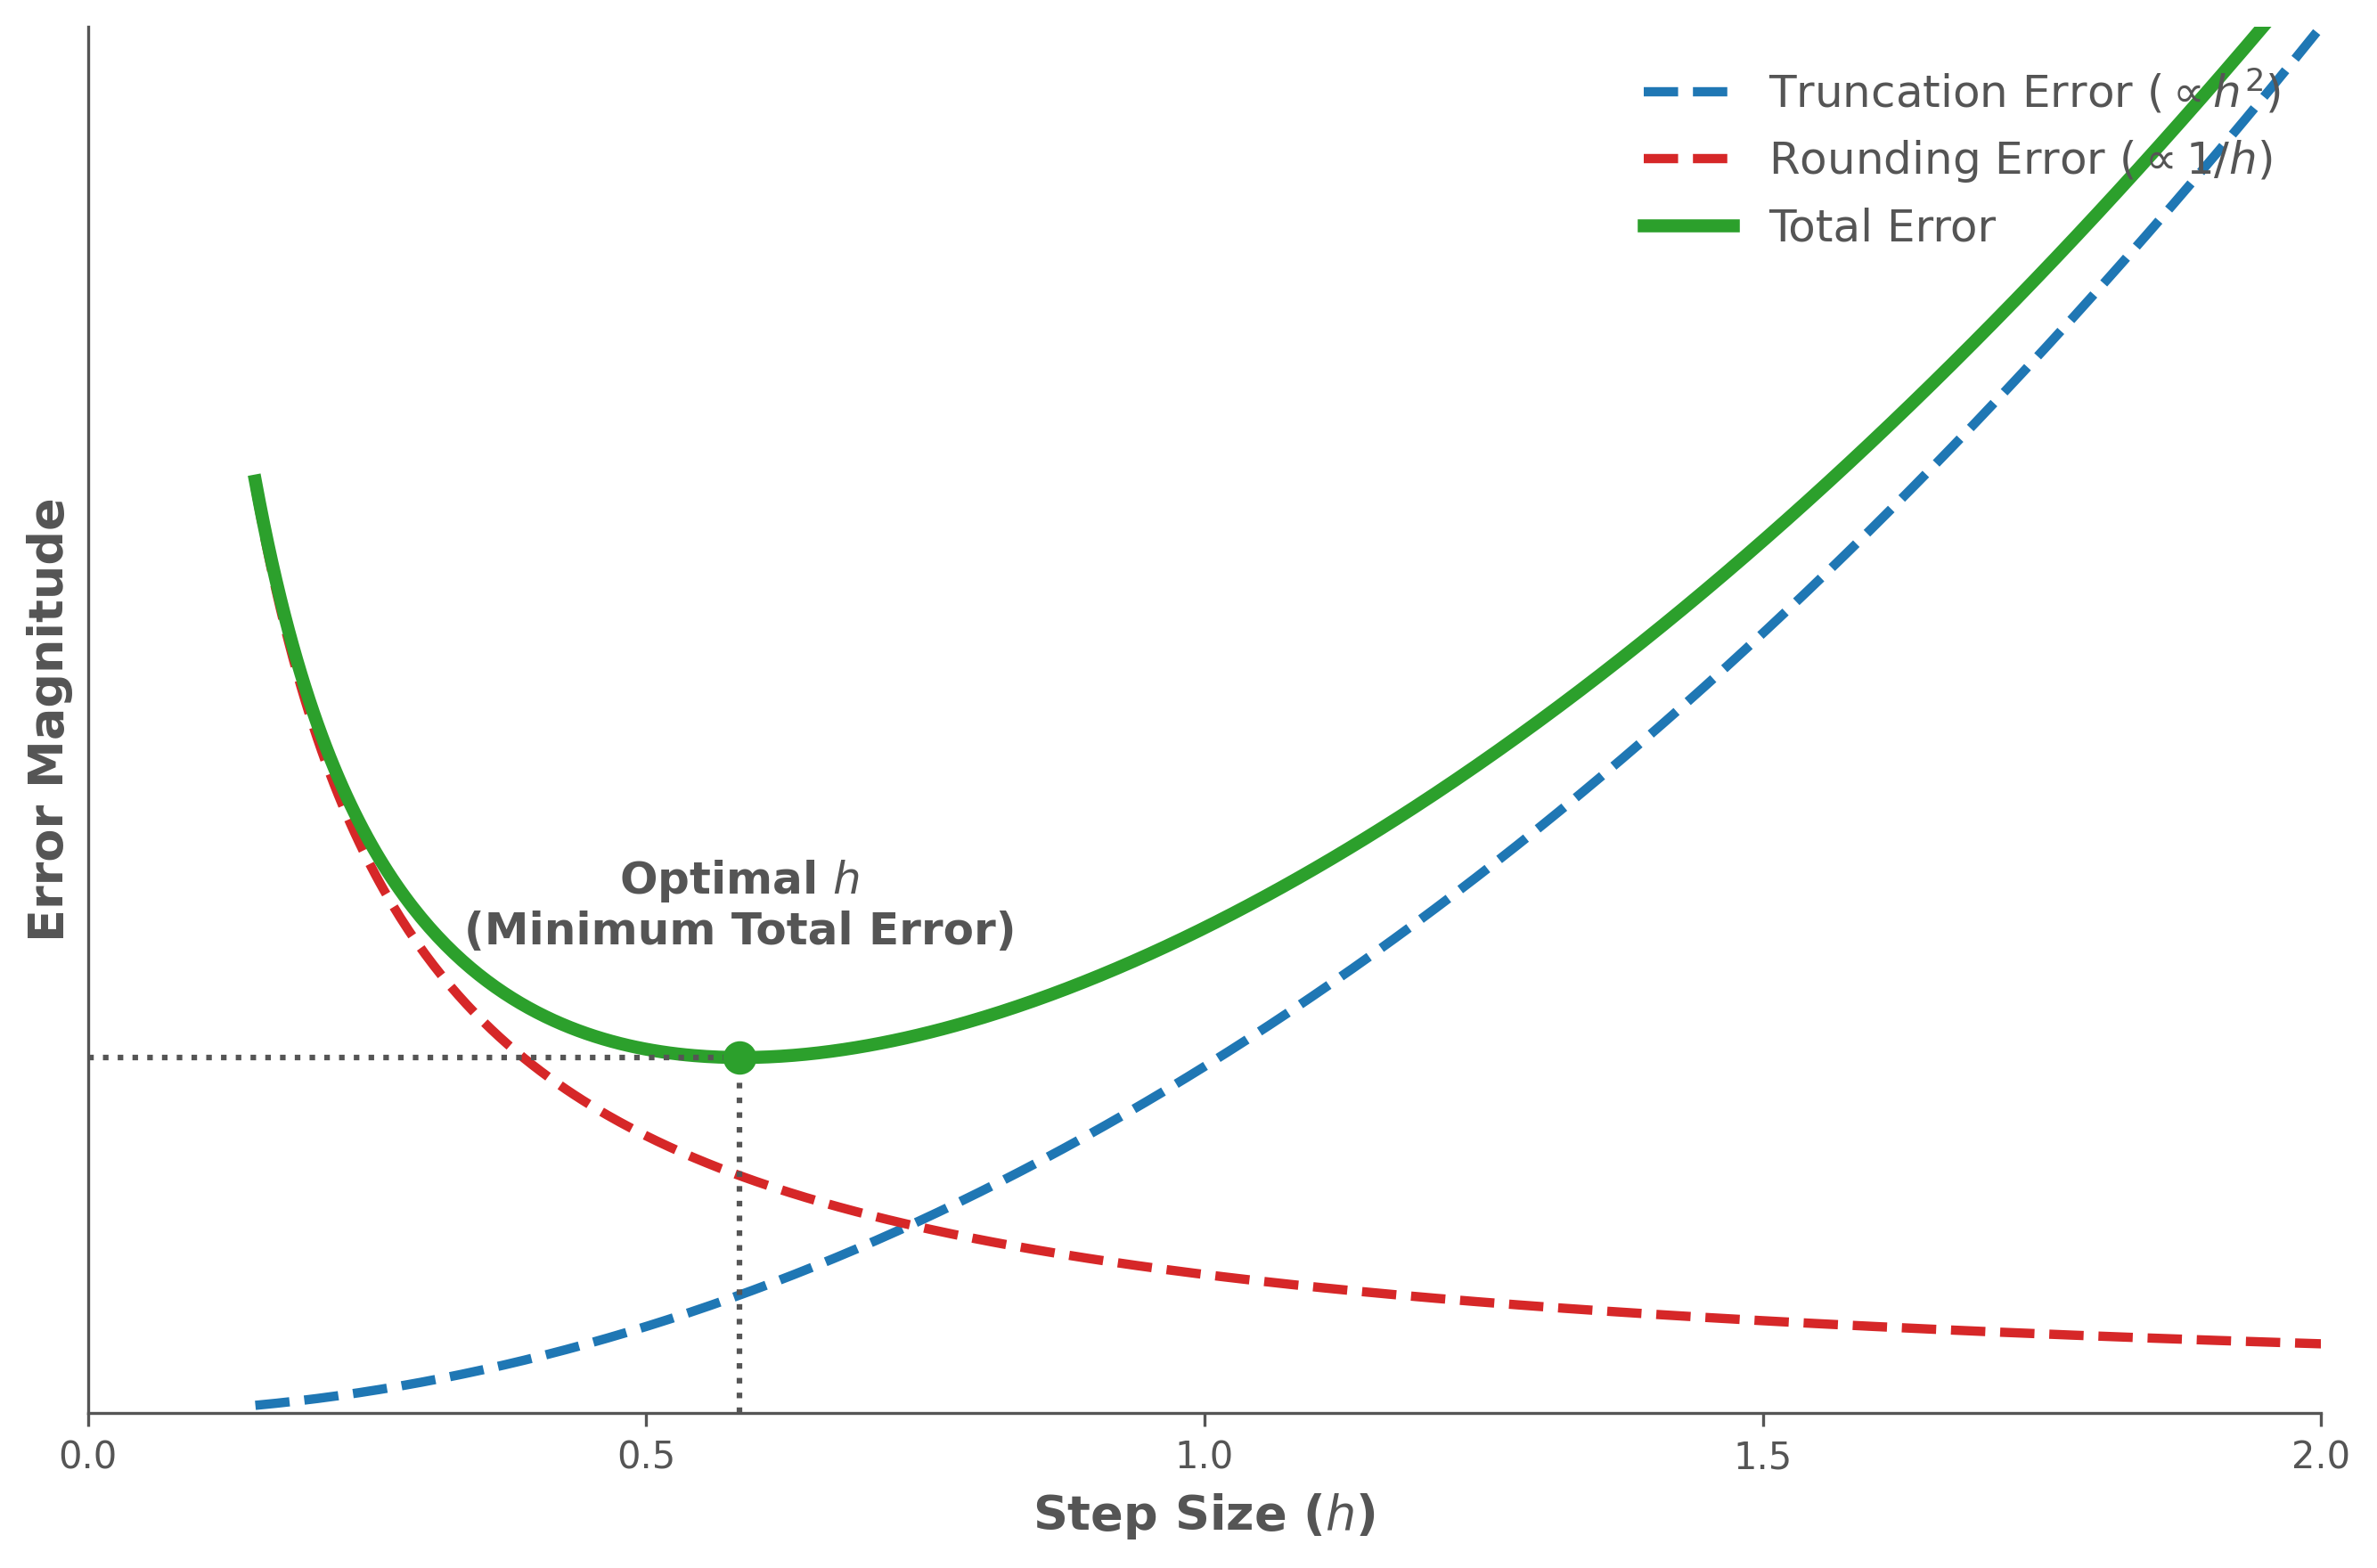
- For large (right side): Truncation error dominates, and the total error is large.
- For small (left side): Rounding error from catastrophic cancellation dominates, and the total error shoots back up.
- At the minimum of the curve: An optimal exists where the two contributions are perfectly balanced, yielding the lowest possible total error.